•

Lead Scoring Models: Start Simple, Validate, Govern for B2B Teams
Lead scoring is the practice of assigning a numeric value to each prospect based on how well they match your ideal buyer and how actively they engage with your brand. The strongest starting point combines fit and engagement into one score, and if your data is thin, a rule-based pilot beats waiting for a perfect model. From there, the path runs through model selection, signal design, validation, sales alignment, and a few regulatory guardrails worth knowing before you automate anything.
TL;DR:
Rule-based scoring is effective for small teams with limited data, while machine learning models improve accuracy when enough historical conversion data exists.
Key signals include firmographic details like company size, demographic factors such as role, and behavioral indicators like demo requests and pricing page views.
Validation through holdout tests, calibration, and CRM pilots is essential to ensure the model’s reliability before full deployment.
Sales trust is crucial; models must be explainable and integrated with clear ownership, thresholds, and governance to encourage adoption.
GDPR requires transparency and human review for lead scores, but routine marketing scoring generally does not fall under the high-risk provisions of the EU AI Act.
AligntccSharpen Your Marketing StrategyAlign TCC helps fast-growing companies build sharper positioning and targeted strategies for changing audiences across multiple markets.Visit Align TCC
Table of Contents
What lead scoring actually means: fit, engagement, and the explicit versus implicit split
Lead scoring models: which approach fits your data maturity
Step-by-step: build a lead scoring model from data to production
Signals and features: what actually moves a B2B lead score
Predictive lead scoring and machine learning: when it’s worth the investment
Validating your score before you trust it
Getting sales and marketing to actually use the score
Privacy and compliance: what GDPR and the EU AI Act require
A compact checklist for building or auditing a lead scoring model
What we’ve learned building scoring models inside real B2B pipelines
Where we fit if you’d rather not build this alone
FAQ
Sources
What lead scoring actually means: fit, engagement, and the explicit versus implicit split
Every qualified pipeline starts with a filter, and lead scoring is that filter made numeric. Without it, sales teams chase whoever filled out a form last, regardless of whether that person can buy or simply wandered in from a blog post. Scoring forces a ranking, which protects selling time and shortens the gap between first touch and closed deal.
Two dimensions do the real work. Fit measures who the lead is: company size, industry, role, budget signals. Engagement measures what the lead does: page visits, email opens, demo requests. Within each, you separate explicit data (what prospects tell you directly, like job title) from implicit data (what their behavior reveals, like repeat pricing-page visits). Neither fit nor engagement alone tells the full story, since a perfect-fit prospect who never opens an email is not sales-ready, and a highly engaged visitor from the wrong industry rarely converts.
A simple 0 to 100 scale works well in practice:
0 to 39: early-stage or unqualified, routed to nurture.
40 to 69: marketing qualified lead (MQL), worth a lighter sales touch.
70 and above: sales qualified lead (SQL), ready for direct outreach.
Negative scoring subtracts points for disqualifying behavior, personal email domains, unsubscribes, students browsing for research, and keeps the upper tiers clean.
Lead scoring models: which approach fits your data maturity
Not every team needs a machine learning pipeline on day one. The right model depends on how much historical data you have, how many leads you process monthly, and how much engineering support you can call on.
Rule-based or manual scoring assigns fixed point values to known attributes and actions. It requires no modeling expertise and works from day one, making it the default starting point for most B2B teams.
Points or scorecard systems extend the rule-based idea with explicit weighting, for example +20 for a demo request, +10 for a pricing-page visit, +15 for a director-level title, and they stay transparent enough for sales to trust immediately.
Engagement or intent models track behavioral density over time, such as content depth, webinar attendance, and repeat visits, and surface buying signals before a prospect ever fills out a form.
Firmographic or demographic scoring prioritizes company size, revenue band, and role fit for early-stage pipelines where behavioral history is still thin.
Negative scoring flags invalid domains, role mismatches, and disengagement, and works alongside any of the models above rather than replacing them.
Predictive models use historical conversion data and statistical or machine learning methods to calculate probability of close, and they add real lift once you have enough labeled outcomes to train on.
Academic research on B2B lead prioritization found that machine learning methods, particularly gradient boosting classifiers, outperformed traditional rule-based scoring on accuracy and AUC across the case studies tested. The same research identified a consistent set of predictive features: lead source, lead status, demo requests, pricing page views, company size, and role, which gives teams a practical starting feature list even before they have enough data for full predictive modeling.
A related study on two-stage prioritization found that clustering leads into profiles before scoring within each segment improved conversion tracking in inside-sales contexts, a useful option when behavioral data is still sparse but firmographic data is rich. Segmenting first, then scoring within segments, often beats a single blended model when your lead pool spans very different buyer types.
Step-by-step: build a lead scoring model from data to production
Building a working model is less about statistical sophistication and more about sequencing. Skip a step here and the model either never gets trusted or never gets used.
Define the objective and success metric. Decide what the score predicts, typically conversion to opportunity or closed-won, and agree on the metric upfront so you can measure whether the model actually works.
Inventory, enrich, and clean your data sources. Pull from your CRM, marketing automation platform, website analytics, and any intent data provider, and resolve duplicate or missing fields before building anything on top of them.
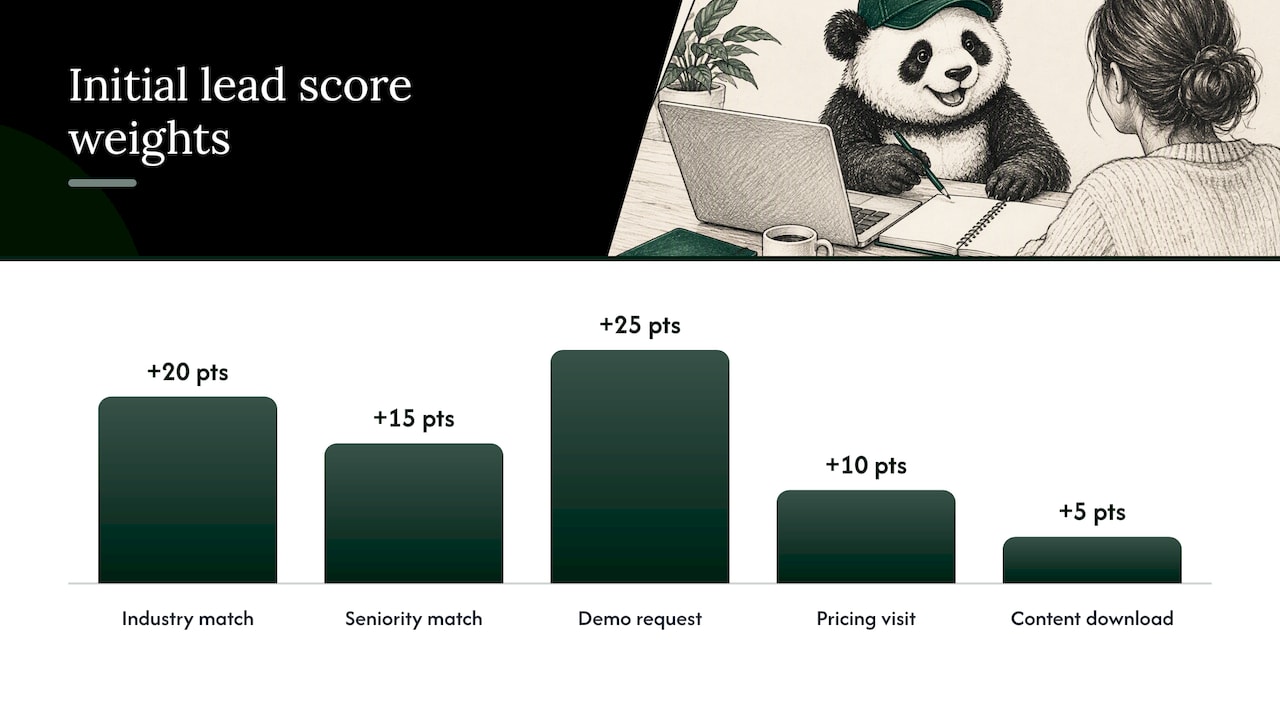
Design the initial scorecard and assign weights. Start with firmographic and demographic fit (industry match: +20, seniority match: +15) alongside behavioral signals (demo request: +25, pricing page visit: +10, content download: +5), and keep the point scale simple enough to explain in one sentence.
Pilot in a spreadsheet before touching automation. Score a sample of recent leads manually, compare the ranking against what sales actually closed, and adjust weights before anything goes live.
Move to CRM rules, then monitored automation. Once the spreadsheet version holds up, encode it as CRM scoring rules with a human reviewing outputs weekly, and only automate routing once that review consistently agrees with the score as explained in this lead generation automation guide.
Iterate through structured experiments. Run champion versus challenger tests on scoring thresholds, and build a regular feedback loop with sales reps so threshold adjustments reflect what they see in real conversations, not just dashboard numbers.
Pro Tip: Run your first scorecard against the last 90 days of closed-won and closed-lost deals before deploying it. If the top-scored historical leads do not match your actual best customers, fix the weights before anyone else touches the model.
Our own process for standing this up inside a client’s revenue team is detailed in our 90-day conversion strategy for B2B teams, which walks through developing, training, and maintaining a scoring model without stalling pipeline in the process.
Signals and features: what actually moves a B2B lead score
Not all signals carry equal weight, and chasing every available data point dilutes the ones that matter. B2B teams generally sort signals into five buckets.
Firmographic: company size, revenue band, industry vertical, and technology stack indicate whether a prospect’s business fits your ideal customer profile.
Demographic: job role, seniority, and department reveal whether the individual can influence or approve a purchase.
Behavioral: pricing page visits, demo requests, content depth, and webinar attendance show active buying interest rather than passive browsing.
Engagement: email clicks, product trial usage, and ad interactions track ongoing interest across channels over time.
Negative signals: invalid email domains, unsubscribes, and obvious role mismatches (students, recruiters, competitors) should subtract points or trigger exclusion.
Feature-importance research on B2B scoring models consistently surfaces lead source and lead status as strong predictors, alongside demo requests and pricing-page visits, which is why those four show up in nearly every scorecard regardless of industry. Keeping your feature list tight and auditable also pays off later: when sales asks why a lead scored high, you want an answer in one sentence, not a spreadsheet walkthrough.
Predictive lead scoring and machine learning: when it’s worth the investment
Predictive scoring earns its complexity once you have enough labeled outcomes, meaning enough historical leads with known won or lost results, to train a model that generalizes beyond your current rules. As a rough guide, teams processing a few hundred qualified leads per month with at least a year of CRM history are usually ready to test it.
Common algorithms, in order of typical adoption: logistic regression for a transparent baseline, decision trees for interpretable splits, random forest for more stable predictions, and gradient boosting frameworks like LightGBM or XGBoost for the strongest raw accuracy. Comparative testing across multiple classifier types found gradient boosting variants scored the highest on accuracy and AUC in B2B lead prioritization, though the gap over simpler models narrows as feature engineering improves.
Explainability tools matter just as much as raw performance. SHAP values, permutation importance, and simple surrogate rule extraction let you show sales reps the top three factors behind any given score, which is often the difference between a model that gets used and one that gets ignored.
Class imbalance is common: most leads do not convert, so training data skews heavily toward negative outcomes.
Threshold tuning often beats oversampling: adjusting the decision threshold using statistics like KS can outperform synthetic oversampling techniques in highly imbalanced B2B datasets.
Drift happens: buyer behavior and market conditions shift, so retraining cadence needs to be scheduled, not reactive.
Sales mistrust is a real risk: a model with no visible logic gets quietly ignored no matter how accurate it is.
A hybrid approach combining machine learning with domain expertise and incremental, interpretable deployment can lead to improved sales adoption and outcomes according to research, according to research on building scoring models sales teams actually use. The study’s core finding: organizational adoption, not model accuracy, is the most common point of failure.
Validating your score before you trust it
A model that looks good in a notebook can still fail in production, so validation needs to happen before automation, not after complaints start.
Key statistical metrics include AUC/ROC for overall discrimination, precision at the top decile (how many of your highest-scored leads actually convert), recall, F1 score for balance between the two, and calibration (whether a score of 70 really means a 70% conversion likelihood). Business KPIs matter just as much: conversion lift versus your previous process, time-to-conversion, and sales throughput on scored versus unscored leads.
Run validation through structured experiments rather than a single backtest. Holdout sets, champion versus challenger comparisons, and small CRM pilots covering one segment or territory all reduce the risk of rolling out a model that only worked on last quarter’s data.
Validation step | What it tests | Typical pass signal |
|---|---|---|
Holdout backtest | Model performance on unseen historical leads | AUC noticeably above a coin-flip baseline |
Precision at top decile | Quality of the highest-ranked leads | Most of the top-scored leads match actual closed-won profiles |
Calibration check | Whether score values map to real probabilities | Predicted and observed conversion rates track closely |
CRM pilot | Real-world sales usage and routing accuracy | Sales reports the ranking matches their own judgment |
Once a model passes these checks, map score ranges to specific actions: which tier triggers an SDR call, which tier goes to nurture, which tier gets excluded entirely. Clear routing rules turn a validated score into a working process instead of a number nobody acts on.
Getting sales and marketing to actually use the score
A statistically sound model that sales ignores delivers zero value. Adoption depends on ownership, transparency, and a review process both teams trust.
Assign clear owners for the score and set a recurring cadence, monthly at minimum, to review performance and adjust weights.
Make every score explainable inside the CRM by surfacing the top contributing signals next to the number itself, not buried in a separate report.
Co-create thresholds with sales, not for them, and run joint pilots so both teams see the same results at the same time.
Build in governance: audit logs for every scoring change, defined retraining triggers, and a human override option for edge cases the model gets wrong.
Pro Tip: Give every scored lead a “top 3 reasons” field visible directly in the CRM record. Reps who can see why a lead scored high trust the number far more than reps who only see the final figure.
Organizational alignment issues like these come up constantly when teams evaluate outside help, and the considerations are similar to those in choosing a marketing agency that delivers results: trust, interpretability, and a willingness to iterate together matter more than any single tool.
Privacy and compliance: what GDPR and the EU AI Act require
Automated lead scoring counts as profiling under GDPR, which means organizations need to provide transparency, enable human review, and maintain audit trails for how scores get generated and used, particularly when a score drives a decision with legal or similarly significant effect on an individual.
On the EU AI Act, routine marketing lead scoring generally does not fall within Annex III’s high-risk categories under current readings, though GDPR profiling duties still apply regardless of the AI Act’s classification, and the compliance timeline itself has shifted as regulators revise deadlines.
Document your model: what data feeds it, what it predicts, and who can override it.
Keep a human in the loop for any scoring outcome that meaningfully affects how a prospect is treated.
Audit for bias periodically, especially if firmographic data could proxy for protected characteristics.
Never extend lead scoring into credit, hiring, or insurance decisions, where the same scoring logic can drift into genuinely high-risk territory under the AI Act.
A compact checklist for building or auditing a lead scoring model
Objective and data: define the success metric and confirm your data sources are clean and accessible.
Model choice and pilot: pick rule-based, predictive, or hybrid based on your data volume, then test it in a spreadsheet before automating.
Validation: run holdout tests, precision-at-top-decile checks, and a live CRM pilot before full rollout.
Governance sign-off: confirm documentation, human override, audit logging, and retraining triggers are all in place.
What we’ve learned building scoring models inside real B2B pipelines
The most common failure we see isn’t a weak algorithm. It’s a scorecard built in isolation from sales, then handed over as a finished product nobody asked for. Reps distrust what they can’t explain, and a score with no visible logic gets quietly routed around within weeks.
The fix is almost always smaller and faster than teams expect: a rule-based pilot scored against 90 days of closed deals, reviewed jointly with sales before anything touches automation. We’ve seen pilots this size surface the three or four signals that actually separate converters from browsers, often different from what the team assumed going in. That single correction, made early, tends to matter more than any amount of later model tuning.
For teams ready to move past spreadsheets without losing that discipline, our 90-Day Conversion Strategy lays out the same sequence we use with clients: define, pilot, validate, automate.
— Kalle
Where we fit if you’d rather not build this alone
Building a lead scoring model that sales actually trusts requires disciplined commercial strategy, combining precision on the framework, fast iterative execution to get it into production, and AI used to sharpen the model rather than replace human judgment.

If you’re weighing a rule-based pilot against a full predictive build, our Commercial Strategy and Demand & Performance services cover exactly that range, from first scorecard to validated automation. Readers planning a cross-market rollout may also find value in a Leadership Trip to see how scoring and buyer behavior shift across regions firsthand. Book a discovery call to map out where your data stands today and what a working pilot looks like within 90 days.
FAQ
What is lead scoring in simple terms?
Lead scoring is a method for ranking prospects by assigning point values based on their fit with your ideal customer profile and their engagement with your brand. The combined score helps sales teams prioritize which leads to contact first instead of working through a list in random order.
What’s the difference between MQL and SQL?
A marketing qualified lead (MQL) shows enough fit and engagement signals to warrant nurturing or a light sales touch, typically scoring in a middle range like 40 to 69 on a 100-point scale. A sales qualified lead (SQL) scores higher, usually 70 or above, and is considered ready for direct outreach from a sales rep.
How do I choose between rule-based and predictive lead scoring?
Rule-based scoring works well when you have limited historical data and need a transparent system sales can understand immediately. Predictive scoring, which uses machine learning methods like gradient boosting on historical conversion data, becomes worth the investment once you have enough labeled closed-won and closed-lost records to train a model that outperforms manual rules.
What metrics validate a lead scoring model?
Statistical validation relies on metrics like AUC/ROC, precision at the top decile, and calibration, which checks whether a score of 70 truly corresponds to roughly a 70% conversion likelihood. Business validation tracks conversion lift and time-to-conversion against your previous process through a monitored CRM pilot before full automation.
Does lead scoring require GDPR or AI Act compliance?
Automated lead scoring counts as profiling under GDPR, which requires transparency, documentation, and a human review option for decisions based on the score. Under current readings, routine marketing lead scoring generally falls outside the EU AI Act’s high-risk categories, though GDPR obligations still apply and using scores for credit, hiring, or insurance decisions can create separate high-risk exposure.
Sources
The relevance of lead prioritization: a B2B lead scoring model based on machine learning
Profiling before scoring: a two-stage predictive model for B2B lead prioritization
Recommended
RELATED INSIGHTS



LET’S TALK
What are you trying to grow next?
Brand, launch, market entry or performance. Book 30 minutes and tell us what you’re working on.